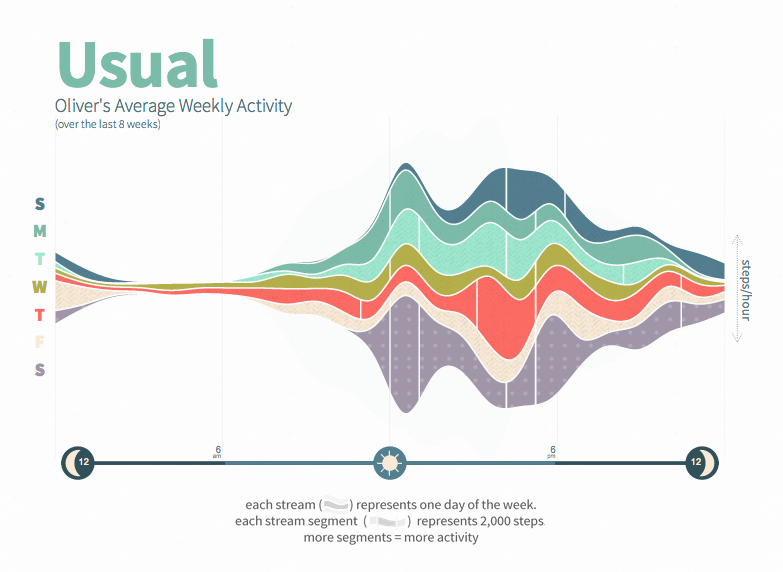
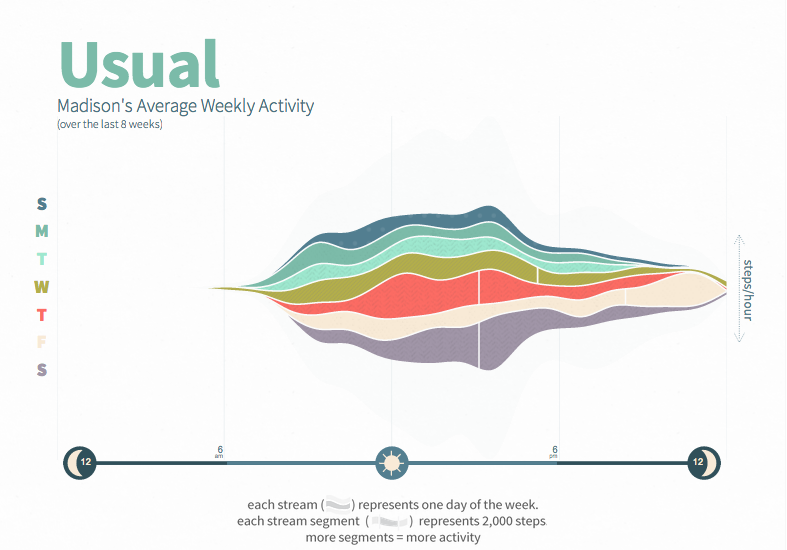
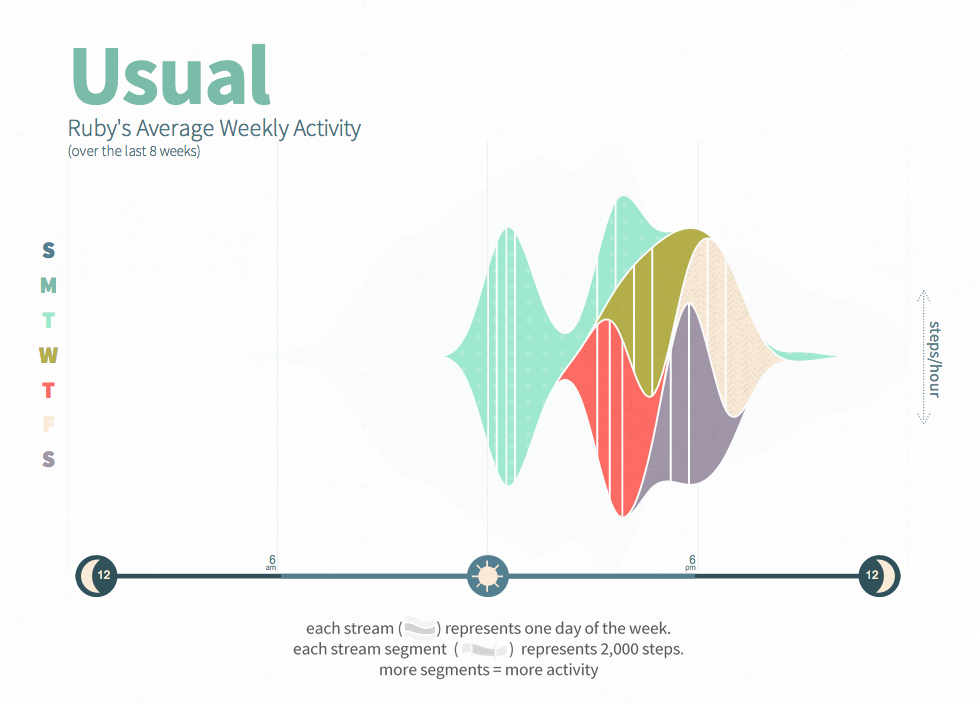
The Usual
The “Usual” dynamic data visualization shows users how their physical activity varies throughout a typical weekday. The visualization was designed to 1) help users see how their behavior varies at different times throughout the day, for each day of the week, 2) help users see their typical sleep habits (via the negative space), and 3) be visually encouraging.
Visualization integrated with hourly step and run data from Fitbit, Jawbone, and RunKeeper.
Colors, texture, and iconography by Mylène Larnaud.
Back.