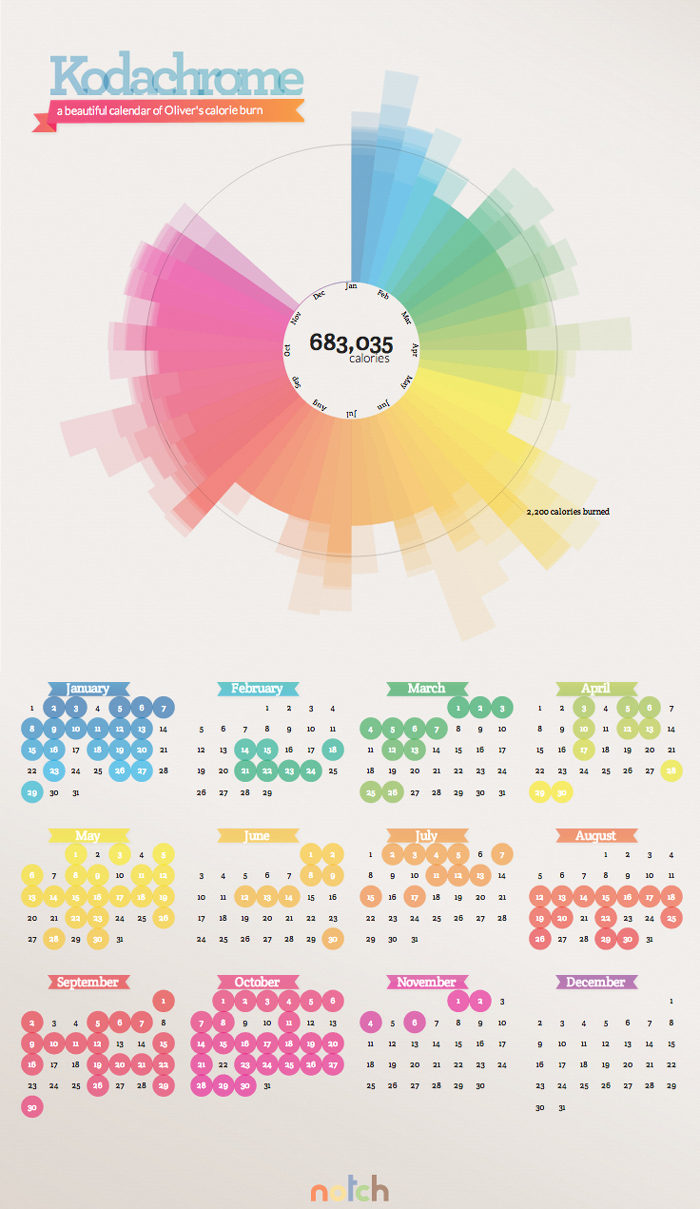
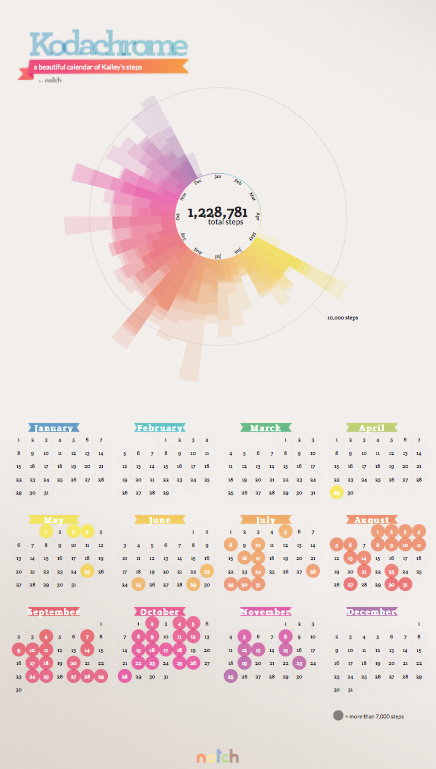
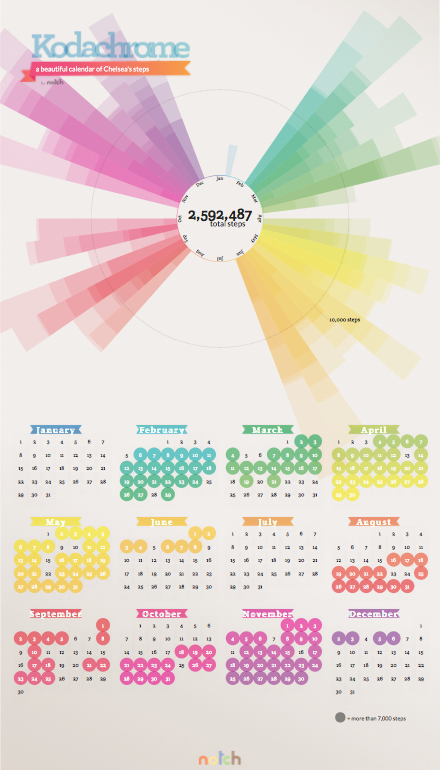
Kodachrome
“Kodachrome,” a dynamic data viz, highlights users’ physical activity over the course of a calendar year. The visualization was designed to 1) help users understand how their behavior varies seasonally, 2) increase awareness of gaps in self-tracking, 3) set expectation that staying physically active is a long term endeavor, and 4) be visually encouraging through aesthetic appeal.
The visualization was created for Notch.me, and integrated with Step and Calorie data from Fitbit, BodyMedia and Jawbone.
Color scheme & title design by Emily Dove.
Back.